
當我們應用個股儀表板找出個股是否出現買進訊號時,要如何提高預測的精準度呢? 在看過大量的個股儀表板圖形後,我發現,如果股價是長期相對弱勢,但在個股儀表板出現不只一個買進訊號之前,股價就開始抗跌或比大盤強,那麼買進訊號的正確度會提高不少。今天就是來跟大家討論這樣的觀察。
請大家先看這張圖,在這張圖裡我們可以發現,當個股儀表板密集出現買進訊號之前,如果個股雖然在盤整,但其實表現的比大盤強,搭配起來就是一個更精準的買進訊號。

首先,先複習一下個股儀表板的腳本
condition1=false;
condition2=false;
condition3=false;
condition4=false;
condition5=false;
condition6=false;
condition7=false;
condition8=false;
condition9=false;
condition10=false;
switch(close)
begin
case >150: value5=low*0.9;
case <50 : value5=low*0.98;
default: value5=low*0.95;
end;
//==========日KD黃金交叉================

input: Length_D(9, "日KD期間");
input: Length_M(5, "周KD期間");
variable:rsv_d(0),kk_d(0),dd_d(0),c5(0);

stochastic(Length_D, 3, 3, rsv_d, kk_d, dd_d);

c5=barslast(kk_d crosses over dd_d);
if c5=0 and c5[1]>20
then condition1=true;
if condition1
then plot1(value5,"月KD高檔鈍化且日KD黃金交叉");
//============內外盤量比差====================
variable:c3(0);
value6=GetField("內盤量");//單位:元
value7=GetField("外盤量");//單位:元
if volume<>0 then begin
value8=value7/volume*100;//外盤量比
value9=value6/volume*100;//內盤量比
end;
value10=average(value8,5);
value11=average(value9,5);
value7=value10-value11+5;
c3=barslast(value7 crosses over 0);
if c3=0 and c3[1]>20
then condition2=true;
if condition2
then
plot2(value5*0.99,"內外盤量比差");

//===========淨力指標==============
variable:c4(0);
input:period2(10,"長期參數");

value12=summation(high-close,period2);//上檔賣壓
value13=summation(close-open,period2); //多空實績
value14=summation(close-low,period2);//下檔支撐
value15=summation(open-close[1],period2);//隔夜力道
if close<>0
then
value16=(value13+value14+value15-value12)/close*100;

c4=barslast( value16 crosses over -4);
if c4=0 and c4[1]>20
then condition3=true;
if condition3
then
plot3(value5*0.98,"淨力指標");

//===========多頭起漲前的籌碼收集================
variable:c2(0);
value1=GetField("分公司買進家數");
value2=GetField("分公司賣出家數");
value3=value2-value1;
value4=countif(value3>20,10);
c2=barslast(value4>6 );
if c2=0 and c2[1]>20
then condition4=true;
if condition4=true
then
plot4(value5*0.97,"籌碼收集");

//===========法人同步買超====================
variable: v1(0),v2(0),v3(0),c1(0);
v1=Getfield("外資買賣超");
v2=Getfield("投信買賣超");
v3=Getfield("自營商買賣超");

c1= barslast(maxlist2(v1,v2,v3)>100);
if c1=0 and c1[1]>20
then condition5=true;
if condition5=true
then plot5(value5*0.96,"法人同步買超");

//========DIF-MACD翻正=============
input: FastLength(12), SlowLength(26), MACDLength(9);
variable: difValue(0), macdValue(0), oscValue(0);
MACD(weightedclose(), FastLength, SlowLength, MACDLength, difValue, macdValue, oscValue);
variable:c6(0);
c6=barslast(oscValue Crosses Above 0);
if c6=0 and c6[1]>20
then condition6=true;
if condition6
then plot6(value5*0.95,"DIF-MACD翻正");
//========資金流向======================

variable: m1(0),ma1(0),c7(0);
m1=GetField("資金流向");
ma1=average(m1,20)*1.5;
c7=barslast(m1 crosses over ma1 and close>close[1]);
if c7=0 and c7[1]>20
then condition7=true;
if condition7
then plot7(value5*0.94,"資金流向");
//=========總成交次數================
variable: t1(0),mat1(0),c8(0);
t1=GetField("總成交次數","D");
mat1=average(t1,20)*1.5;
c8=barslast(t1 crosses over mat1 and close>close[1]);
if c8=0 and c8[1]>20
then condition8=true;
if condition8
then plot8(value5*0.93,"成交次數");
//=========強弱指標==================
variable:s1(0),c9(0);
s1=GetField("強弱指標","D");

c9=barslast(trueall(s1>0,3));
if c9=0 and c9[1]>20
then condition9=true;
if condition9
then plot9(value5*0.92,"強弱指標");
//============開盤委買================
variable:b1(0),mab1(0),c10(0);
b1=GetField("主力買張");
mab1=average(b1,10);
c10=barslast(b1 crosses over mab1);
if c10=0 and c10[1]>10
then condition10=true;
if condition10
then plot10(value5*0.91,"主力買張");
從這腳本我們可以了解,個股儀表板的目的,在於透過不同的資料欄位,標示出個股可能值得買進的訊號,但這些訊號如果是在多頭末昇段時,也可能會出現,這時候我們可以搭配轉強天數指標來一起看,如果轉強天數指標是從低檔穩定在上昇,就更值得留意。
我自己的轉強天數指標是這麼寫的
input:period(20);
value1=GetField("強弱指標","D");
//個股漲跌幅減加權指數漲跌幅
value2=GetField("資金流向");
value3=countif(value1>0 and value2>value2[1],period);
plot1(value3);
想法是計算過去一段時間比大盤強且佔大盤成交量比重也比前一天高的天數。
這兩個指標一起搭起來看,可以找到那些埋伏一段時間後開始要發動攻勢的股票
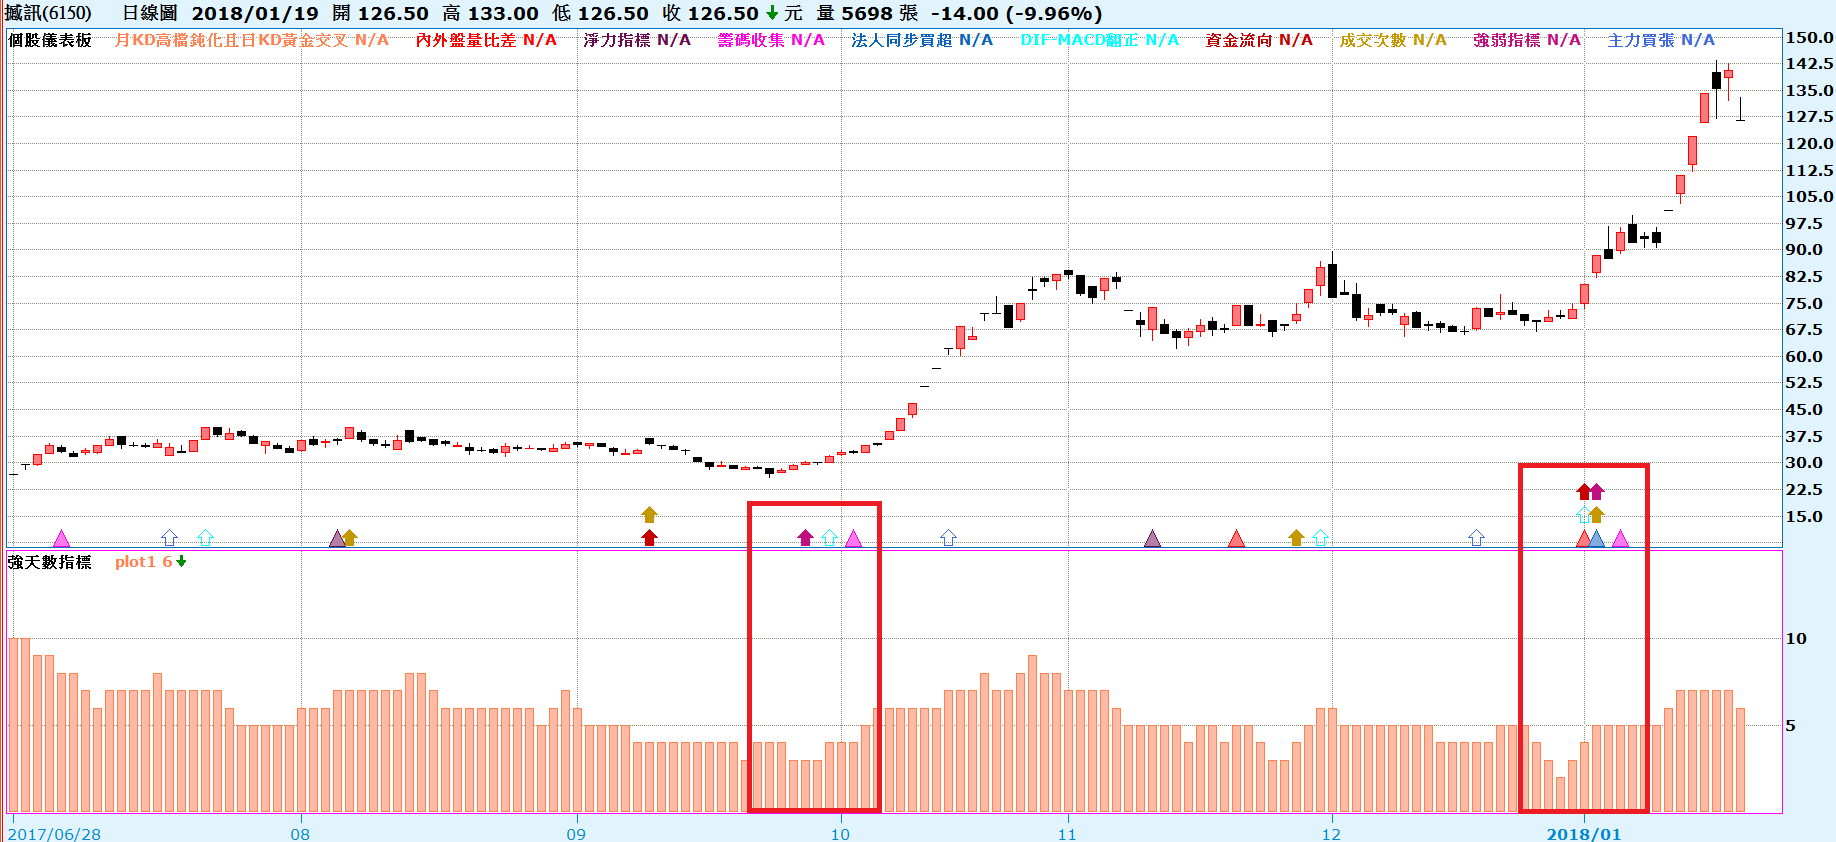
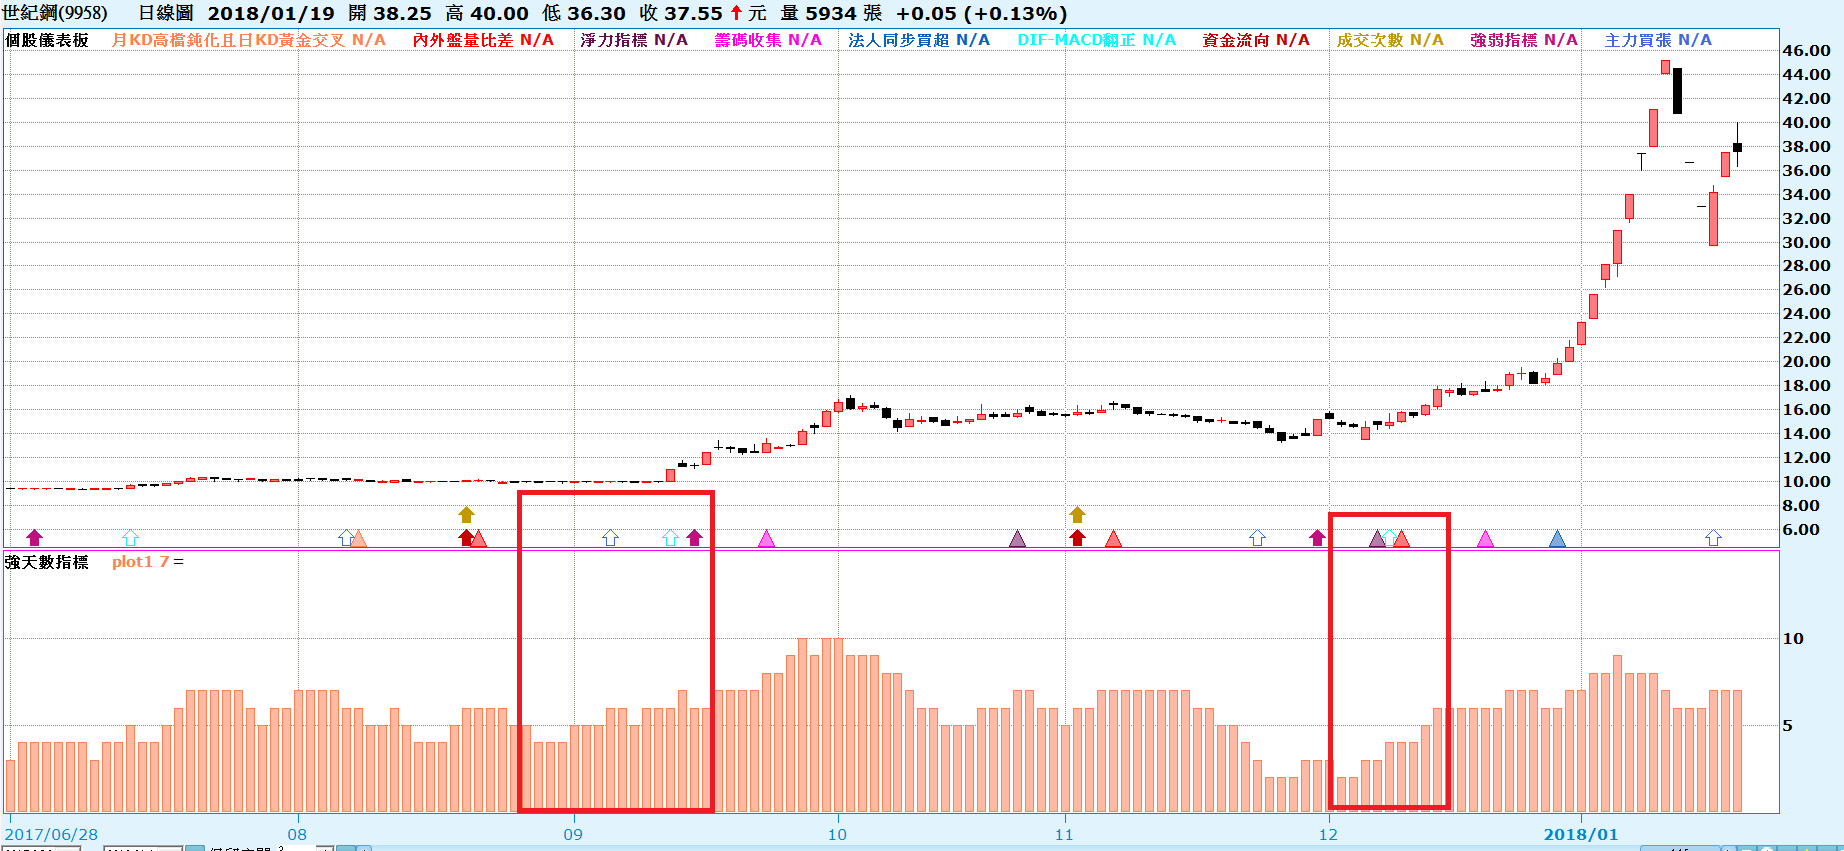
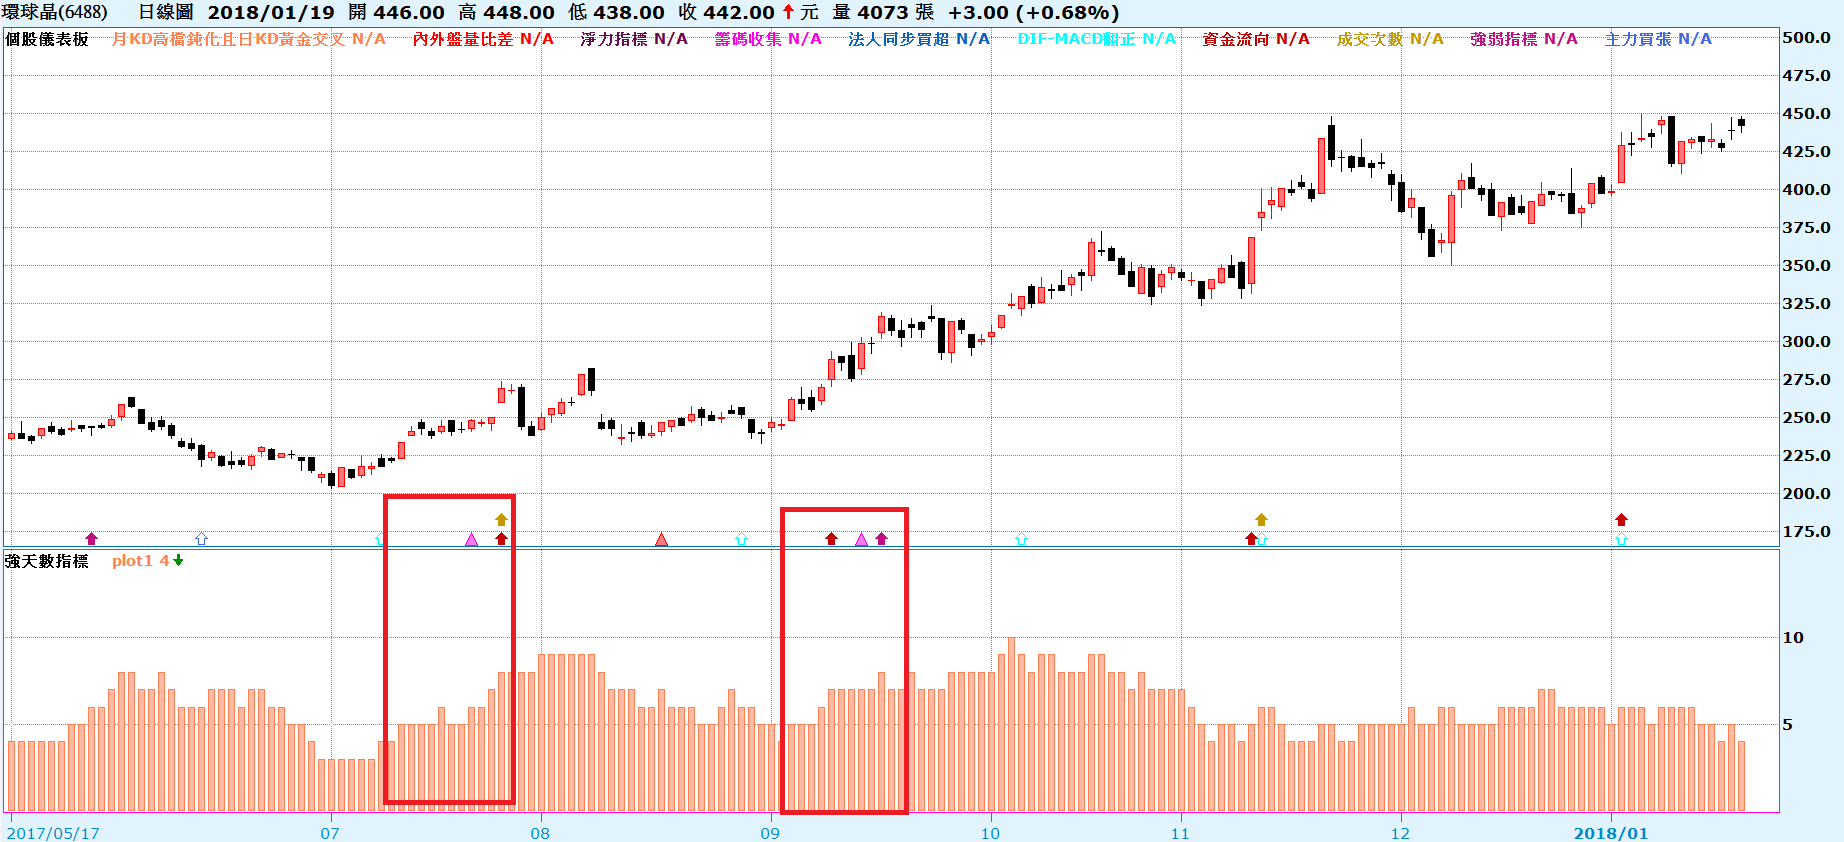
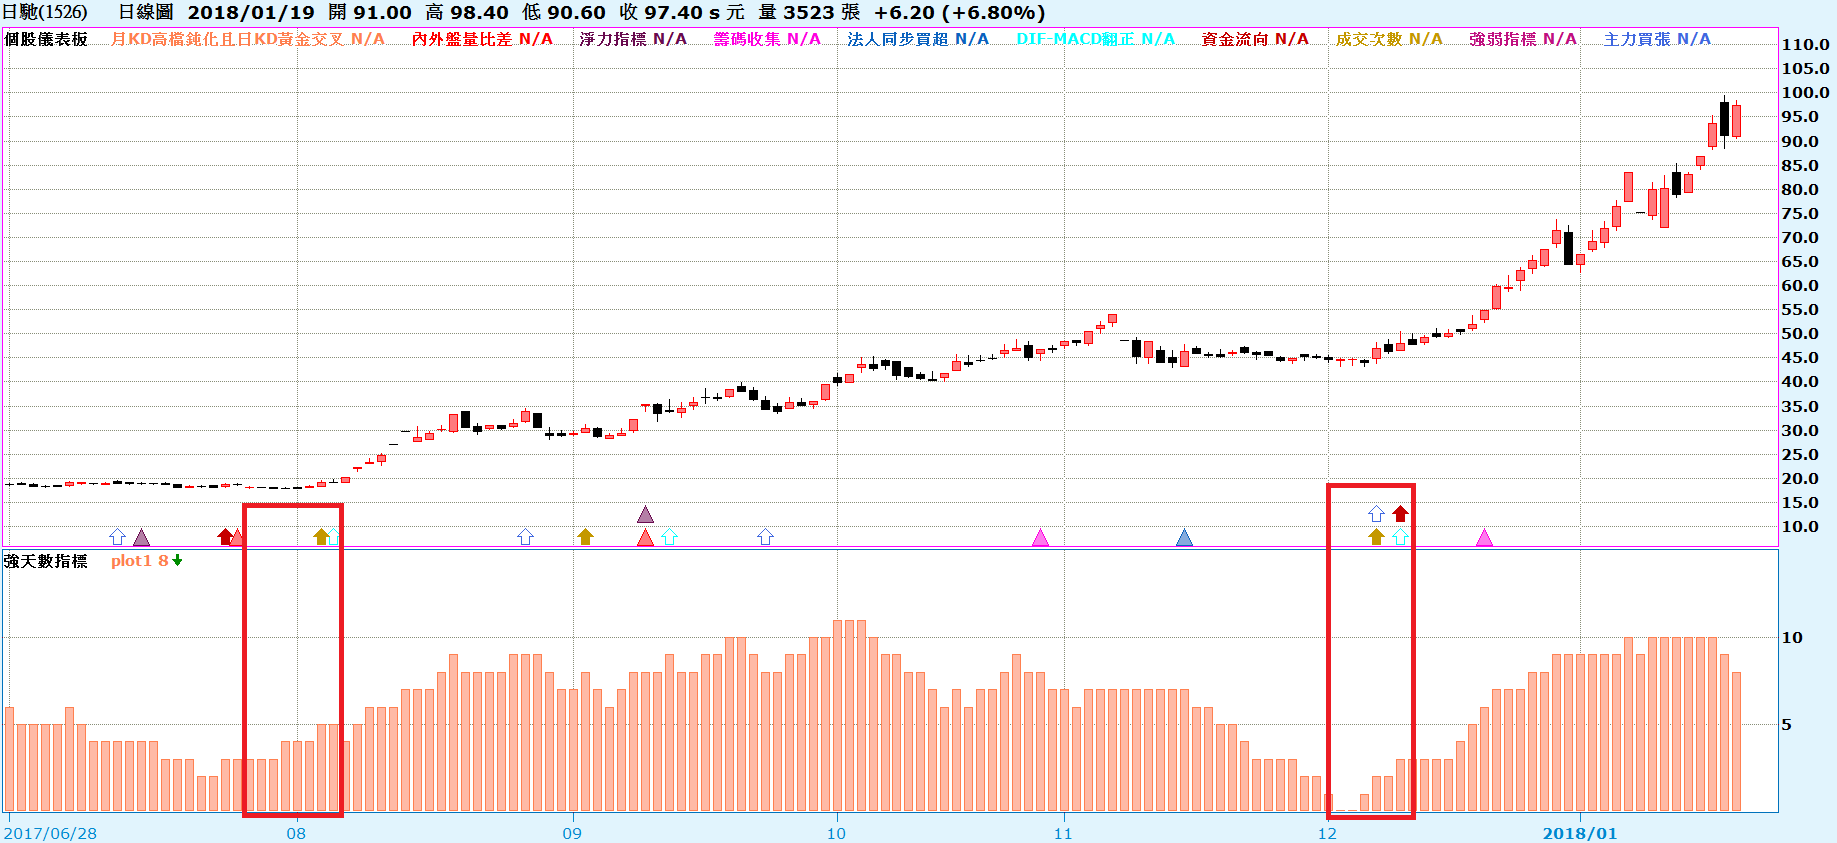
以下是最近很強的股票過去在起漲點時,這兩個指標的搭配情況
以上是我在用個股儀表板時偶然發現的現象 ,野人獻曝一下