
有網友希望提供內外盤的即時指標,但因為目前指標裡無法支援內外盤的flag,所以我改變一下寫法,寫了一個盤中上漲量與下跌量的差額指標,大家可以參考看看
首先依慣例還是先給腳本
1variable:i(0),tv(0),tp1(0),tp(0); 2i=0; 3if date<>date[1] then begin 4value1=0; 5value2=0; 6end; 7if V>0 8then begin 9while GetField("時間","Tick")[i]>=time and GetFieldDate("成交量","Tick")[i]=date 10i+=1; 11while i>0 12begin 13i-=1; 14tv=GetField("成交量","Tick")[i]; 15tp=GetField("收盤價","Tick")[i]; 16tp1=GetField("收盤價","Tick")[i+1]; 17if tp>tp1 //上漲 18then begin 19condition1=true; 20condition2=false; 21end; 22if tp<tp1 23then begin 24condition1=false; 25condition2=true; 26end; 27if condition1 then value1+=tv;//上漲成交量累加 28if condition2 then value2+=tv;//下跌成交量累加 29end; 30end; 31value3=value1-value2; 32plot1(value3,"累計上漲下跌量差");
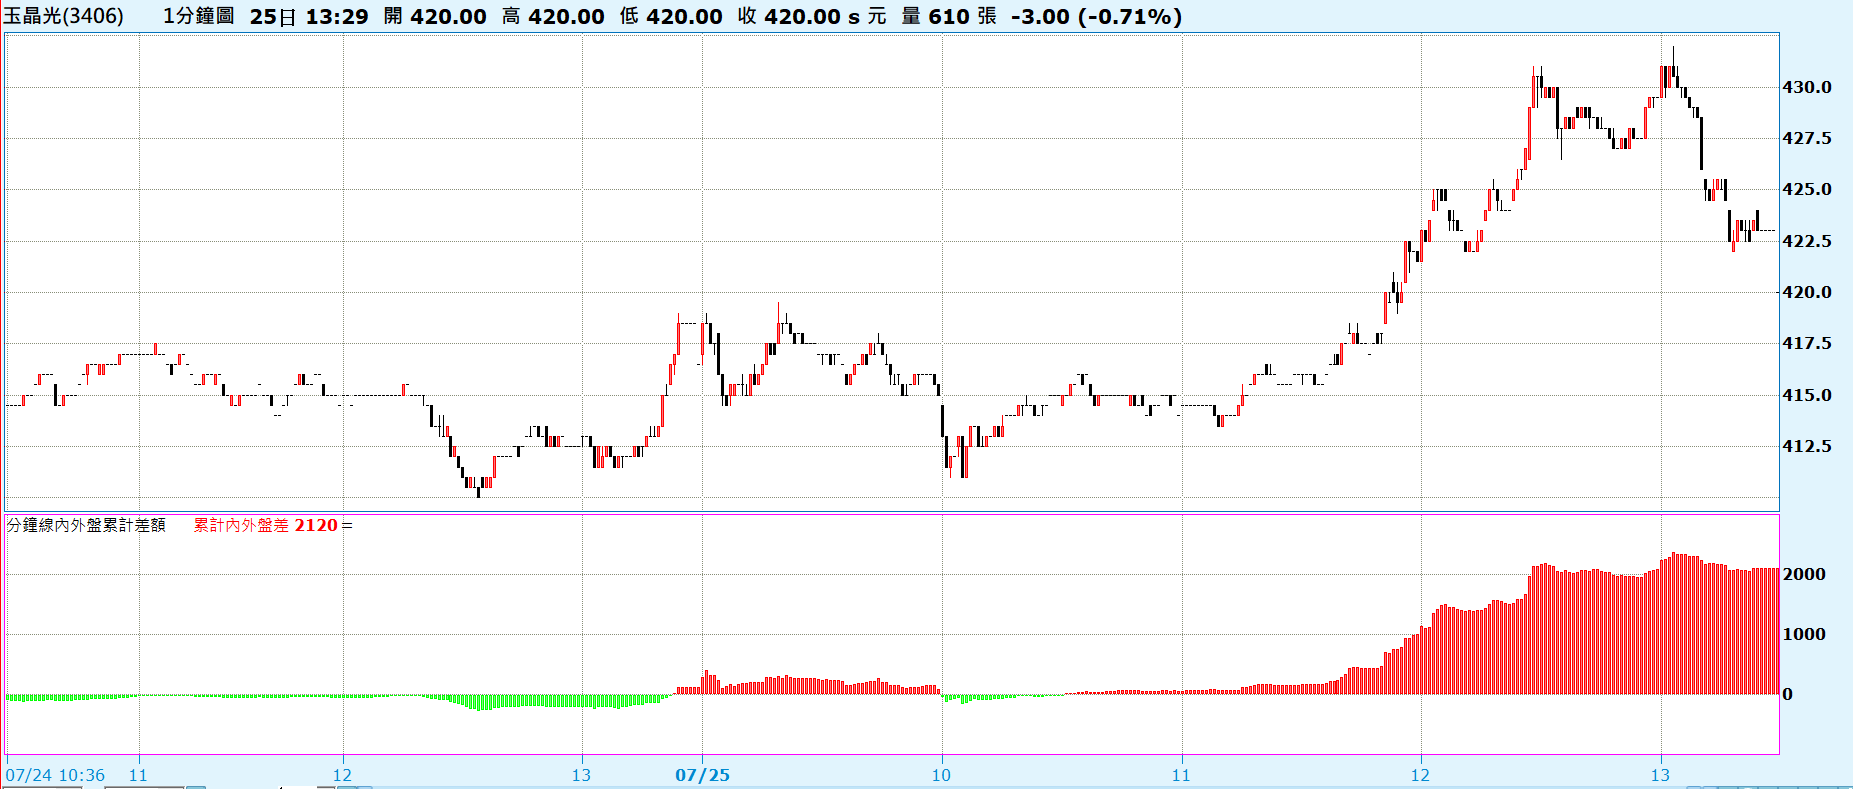
用這個腳本畫出來的圖如下
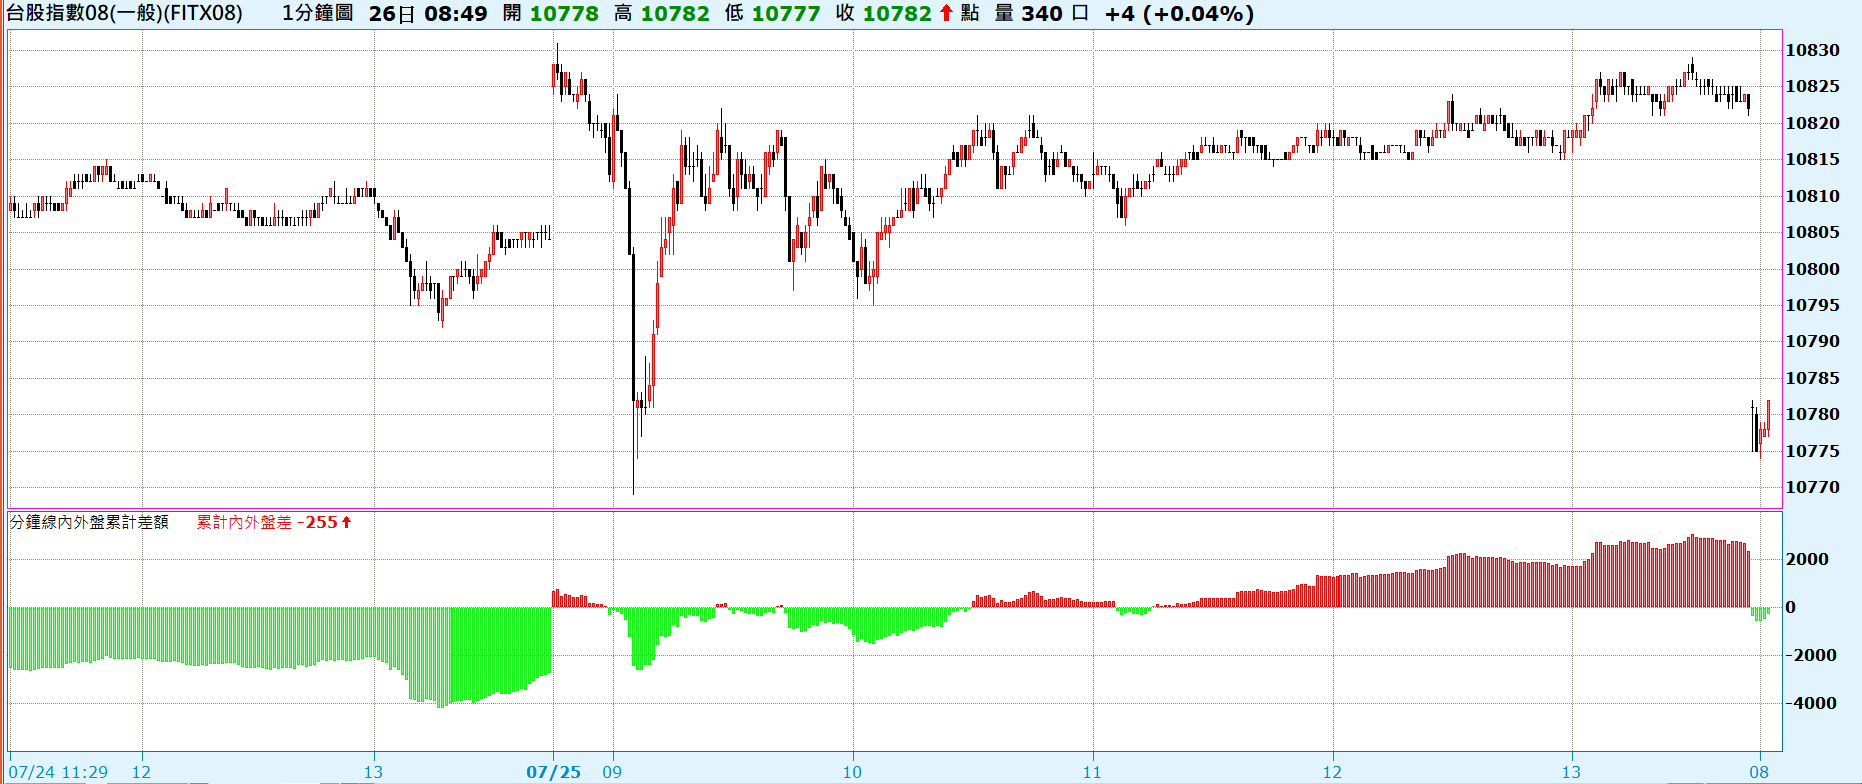
用在期指上的圖形如下
這種盤中統計市場買賣方道消長的指標,確實在作當沖或進出場點決策時,有很大的幫助,我聽說XQ7.0會支援更多QUOTE的欄位可以支援到指標畫圖腳本中,到时候再跟大家分享更多的指標畫法。