研究過許多策略後,會發現一種情況,最後是有效而能存活的策略,都會引用到波動率的概念!
這是為什麼呢? 照一個最基本的邏輯去看,要有獲利,其實就是在買進賣出間得有一定足夠的價差,讓這筆交易買在較低的點,賣出在較高的點,扣除手續費後,才是淨資本利得。
這件事最大的關鍵點就是”足夠的價差”!!
這意謂著,當在發展策略的時候,最好都要以這個點當作重要的參考依據,因為這是獲利的來源!! 所以絕大多數的策略,都會將波動率考慮進去,當做是必要參數!!
今天我們再來看一個常用的訊號,這是利用每天的價差高低點,計算出一個通道,突破通道上緣且收最高則作多,反之則標記作空。
我們先建立一個趨勢函數:LongShortTrend 腳本如下:
1input: ATRLength(NumericSimple), ATRMult(NumericSimple), Strength(NumericSimple), sTrend(NumericRef); 2var:mATR(0), avg(0), mLower(0), Upper(0), trend(1), flag(0), flagh(0), xTrend(0),HighLow(0); 3 4HighLow = Highest(High, ATRLength) - Lowest(Low, ATRLength); 5mATR = XAverage(HighLow, ATRLength); 6avg = (XAverage(high, Strength) + XAverage(low, Strength))/2; 7Upper = avg + mATR; 8mLower = avg - mATR; 9 10if c > Upper[1] and c > Highest(High, Strength)[1] then trend = 1 11else if c < mLower[1] and c < Lowest(Low, Strength)[1] then trend = -1; 12 13if trend < 0 and trend[1] > 0 then flag=1 else flag=0; 14if trend > 0 and trend[1] < 0 then flagh = 1 else flagh = 0; 15 16if trend > 0 and mLower < mLower[1] then mLower=mLower[1]; 17if trend < 0 and Upper > Upper[1] then Upper=Upper[1]; 18 19if flag = 1 then Upper = avg + mATR; 20if flagh = 1 then mLower = avg - mATR; 21 22if trend = 1 then xTrend = mLower else xTrend = Upper; 23LongShortTrend = xTrend; 24sTrend = trend;
從這個函數很明顯可以看出,我們用高低點價差的均值和高低中價均值去做了一個通道,畫出指標腳本用下面腳本
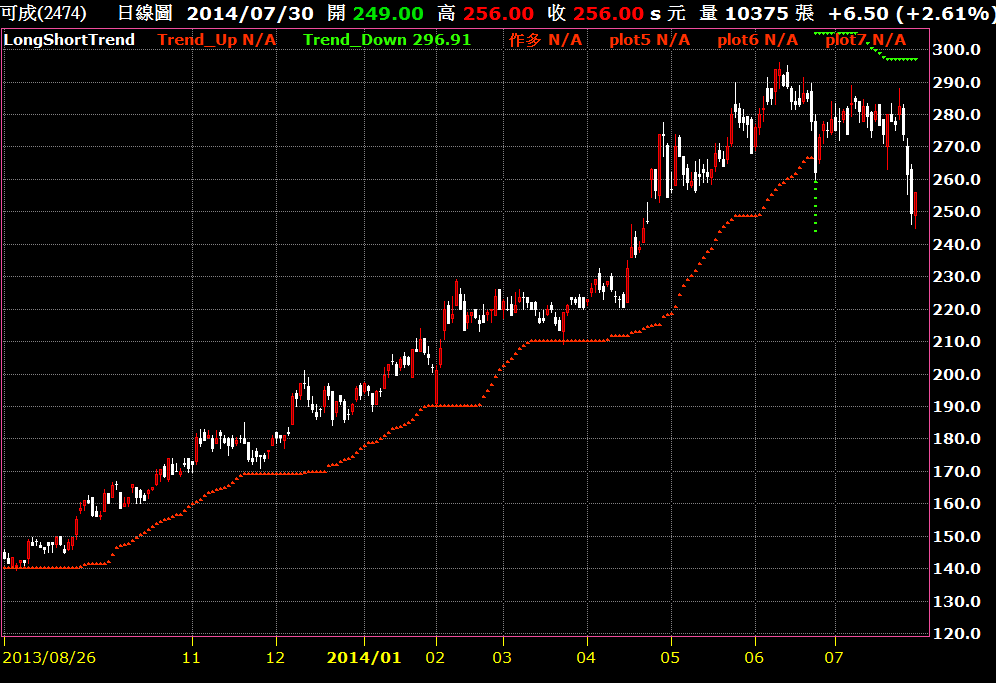
1input: Length(9), Multi(1), Strength(9); 2variable: strend(0),LS(0); 3LS = LongShortTrend(Length, Multi, Strength, strend); 4if strend = 1 then Plot1(LS,"Trend_Up") else Plot2(LS,"Trend_Down"); 5 6if C cross above LS then 7begin 8plot4(C*1.01 ,"作多"); 9plot5(C*1.02);plot6(C*1.03);plot7(C*1.04); 10plot8(C*1.05);plot9(C*1.06);plot10(C*1.07); 11end; 12 13if C cross below LS then 14begin 15plot11(C*0.99 ,"作空"); 16plot12(C*0.98);plot13(C*0.97);plot14(C*0.96); 17plot15(C*0.95);plot16(C*0.94);plot17(C*0.93); 18end;
這樣很明顯可以看出,當股價一有趨勢時就會出現訊號,做為明確的買賣依據!!